As per a recent study published in EURASIP Journal, video streaming is becoming one of the most popular services. According to the study, video streaming will occupy more than 77% of all consumer Internet traffic by 2021. This growth in demand for video streaming is leading to challenges in optimizing network resources to improve the user perceptual experience. In a State of Online Video report, indicated that 78% of the total 1,779 survey respondents reported that they would stop watching a video if it buffers more than three times during playback. For businesses, this means that if there are issues in the network that lead to buffering, the data suggests that video consumption will fall. This decreases the value of the video content, directly impacting the return on investment (ROI) businesses hope to drive from their enterprise video strategy. Thus, the future and success of companies will depend on their ability to prevent viewers from abandoning videos in between, giving them a better Quality of Experience (QoE) because what the customers say about the business affects credibility and image of the company.
Quality of Service (QoS) is an industry-wide set of standards for ensuring high-quality video performance for critical applications and is commonly used by network administrators to make efficient use of existing resources and to provide the required level of video service without overwhelming the network.
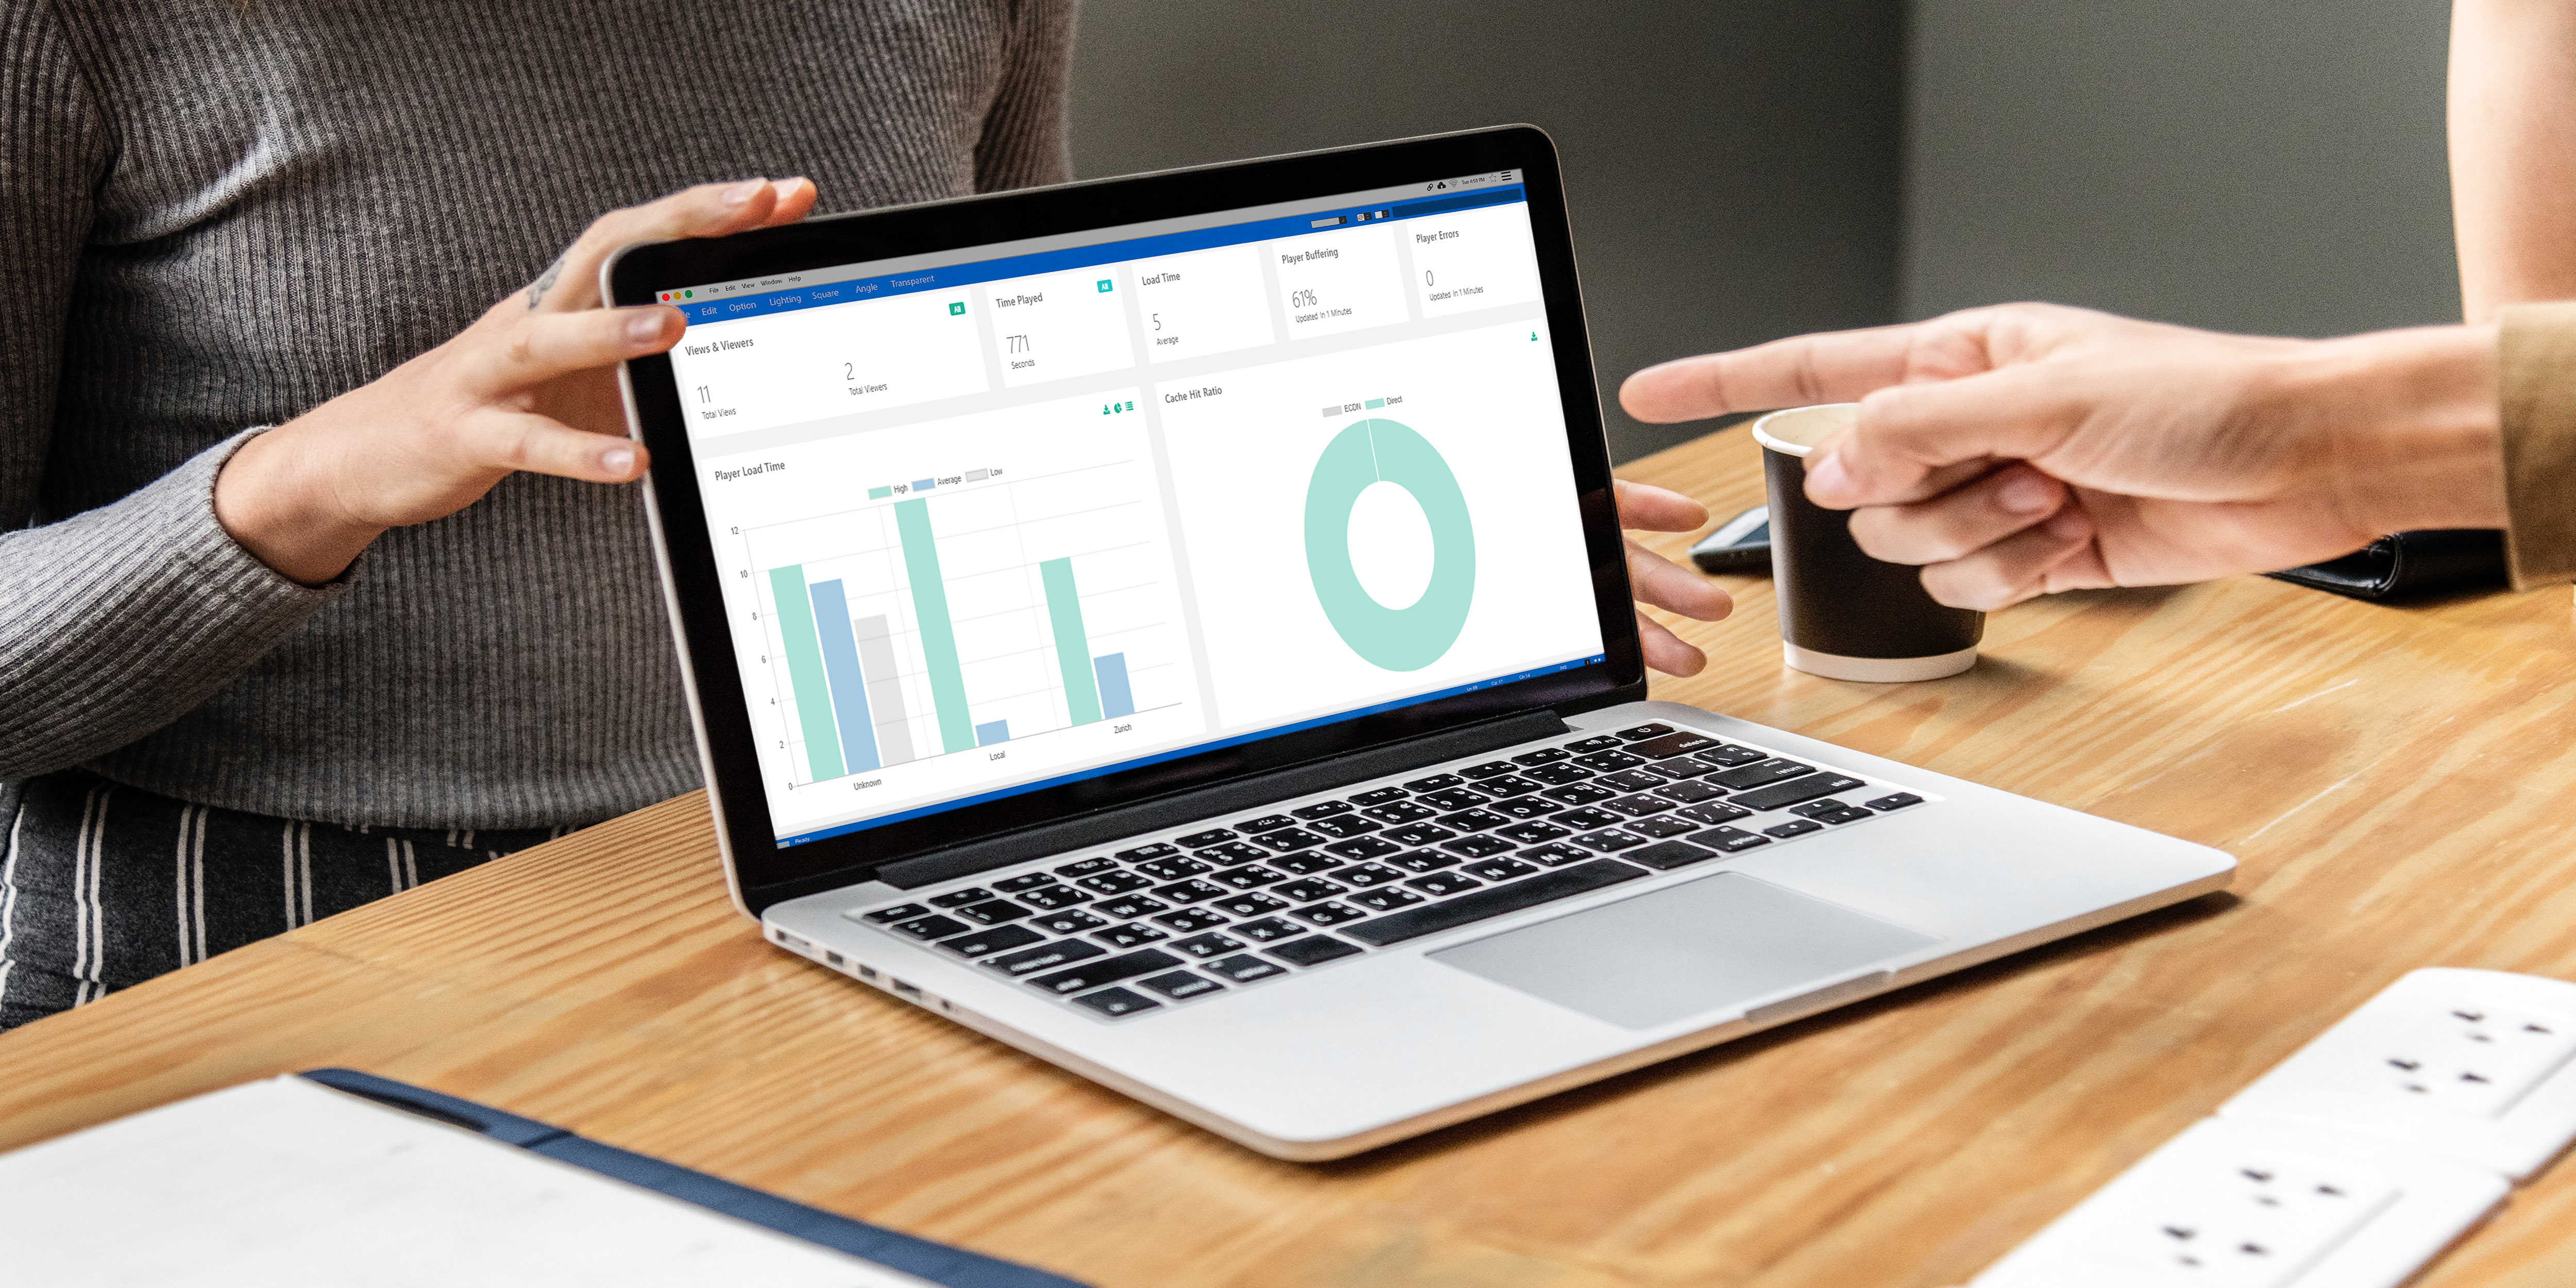
VIDIZMO, an enterprise video platform provides out-of-the-box analytics to its customers for optimizing and enhancing end-user's Quality of Experience (QoE). These specific analytics cover during and after-delivery statistics for every viewed video. Customers can use the analytics to assess video delivery experience, identify, and resolve any Quality of Service (QoS) issues, therefore improving the QoE for end-users. The following are the type of QoE analytics provided by VIDIZMO’s enterprise video platform:
-
Views & Viewers: This denotes the total number of views for the video and the total number of viewers. There could be multiple views from a single viewer.
-
Time Played: This represents the aggregated sum of the seconds of video played from all views.
-
Load Time: This denotes the average time it took for the player to load every time a viewer landed on the video's playback page.
-
Player Buffering: This is the percentage of the amount that the player buffered during playback. It is updated every 15 minutes.
-
Player Errors: This is the number of times that the player failed to load due to any reason.
-
Player Load Time: This is divided bar graph showing the maximum, minimum, and average time it took for the player to load in every location that it was accessed from.
-
Cache Hit Ratio: It is the ratio of how many times the origin server was accessed to get the content and how many times it was served from the edge nodes.
-
Device Buffering: This shows the devices where the player buffered.
-
Device Errors: This is the graph representing the device that endured errors while playing back the video.
-
Buffering Heat Map: This is a heat map showing buffering of video across global locations.
-
Error Heat Map: This shows a heat map of the intensity with which errors occurred across global locations.
-
Video Quality Played: This is a bar graph explaining how much each video quality was played.
QoE Application in Industries
Marketing
Companies with a large national or international market which geographically segment their video marketing content such as advertisements because of different consumers in different regions, having varying needs, wants and cultural characteristics that are targeted explicitly through videos. Due to VIDIZMO’s QoE analytics such as error heat maps, buffering heat maps, and player load time companies can determine which video content to distribute the most popular videos at the servers close to users so that businesses can significantly reduce the streaming latency due to buffering.
Advertisement
Most advertisers use technology that places an ad player on top of the video player thereby increasing the risk of buffering- and aggravating viewers- because the technology relies on content and ad players talking to each other. This approach becomes even more problematic with mobile devices. “That was a method that worked in a desktop environment but works less and less with the proliferation of mobile devices,” says Jeremy Helfand, vice president of Adobe Primetime. By using VIDIZMO’s QoE monitoring analytics such as device buffering, and device errors advertisers can determine which devices are experiencing the most issues and use different advertisement strategies such as running a linear (pre-roll, mid-roll, and post-roll) or non-linear ads. QoE monitoring also empowers businesses on which ad creative should be optimized for the delivery of advertisements.
The analytical results offered by VIDIZMO an enterprise video platform’s QoE analytics offer businesses useful insights in improving their enterprise video strategy, which paves the way toward a high-quality viewing experience with applications in several different industries.
For a detailed exploration of VIDIZMO’s analytics, read Video Analytics: Measuring the true value of your Enterprise Video Content Strategy
If you would like to know how VIDIZMO can address your company’s Enterprise Video Content Management and Platform challenges, contact us today or visit our website for details.
Posted by VIDIZMO Team
We at VIDIZMO are experts in secure and compliant video streaming and digital evidence management. Our aim is to help educate such that you can better utilize your video data.
- Tags
- EVCM


